Ranked Ballots
One idea to reduce incentives for strategic voting is to let voters rank all of the candidates using a ranked ballot:
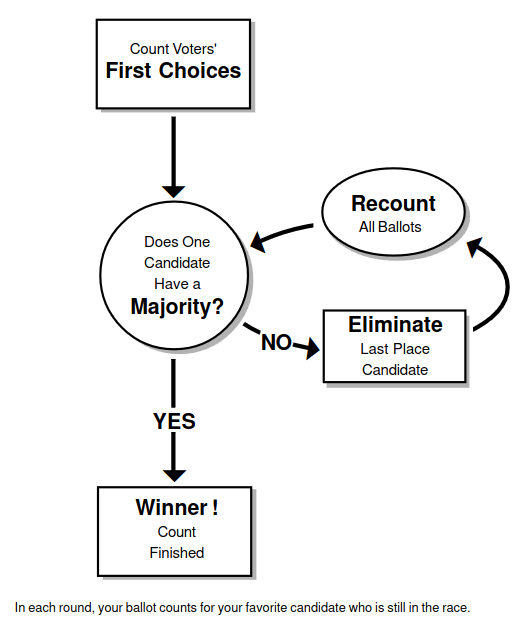
A popular method to pick the winner of an election using ranked ballots is instant run-off voting (IRV).
Brian Lins
Tuesday, May 21, 2024
The simplest way to pick a winner in an election with several candidates is the plurality method: whichever candidate gets the most votes wins.
The candidate with the most votes is called the plurality candidate.
If a candidate gets more than 50% of the votes, then they are a majority candidate.
Majority ≠ Plurality. A majority candidate is always a plurality candidate, but not vice versa.
Spoiler candidates are closely related to:
Exercise. Can you think of any recent examples of elections with spoiler candidates and/or strategic voting?
One idea to reduce incentives for strategic voting is to let voters rank all of the candidates using a ranked ballot:
A popular method to pick the winner of an election using ranked ballots is instant run-off voting (IRV).
A club wants to get their dinner catered by a local restaurant, so they vote on which restaurant to pick.
| Number of Voters | |||||
|---|---|---|---|---|---|
| 33 | 30 | 25 | 20 | 18 | |
| Italian | 2nd | 5th | 1st | 2nd | 3rd |
| Mexican | 1st | 4th | 5th | 4th | 1st |
| Thai | 3rd | 1st | 4th | 5th | 2nd |
| Chinese | 4th | 2nd | 3rd | 1st | 4th |
| Indian | 5th | 3rd | 2nd | 3rd | 5th |
A row represents one candidate, and each column shows the rankings of a group of voters. All of the voters in one column have the same preference ranking.
Exercise. How many voters voted in this election? How many votes would it take to get a majority?
Exercise. Which restaurant wins the election using instant run-off voting?
In 2020, Alaska passed a law to use Instant Run-Off Voting to elect the state’s one representative to the House of Representatives. The method was used for the first time in 2022. The numbers below are not the actual election results, but they are close, and they illustrate what happened.
| Number of Voters | ||||
|---|---|---|---|---|
| 75,000 | 58,000 | 28,000 | 16,000 | |
| Mary Peltola (D) | 1st | 3rd | 3rd | 2nd |
| Sarah Palin (R) | 3rd | 1st | 2nd | 3rd |
| Nick Begich III (R) | 2nd | 2nd | 1st | 1st |
About 177,000 people voted. More than 88,500 first place votes would be needed to get a majority.
Exercise. Use IRV to find the winner of the election.
Exercise. Was there a spoiler candidate in the Alaska election? Who?
Here is an example from Excursions in Modern Mathematics by Peter Tannenbaum.
Three cities are competing to be the host city for the Olympic Games. The final decision is made by a secret vote of the 29 member International Olympic Committee. Suppose the votes were going to be:
| Number of Voters | ||||
|---|---|---|---|---|
| 7 | 8 | 10 | 4 | |
| Athens | 1st | 3rd | 2nd | 1st |
| Barcelona | 2nd | 1st | 3rd | 3rd |
| Calgary | 3rd | 2nd | 1st | 2nd |
So Calgary will win after Barcelona gets eliminated in the first round.
What happens if the 4 voters in the last column switch their votes to help Calgary?
| Number of Voters | ||||
|---|---|---|---|---|
| 7 | 8 | 10 | 4 | |
| Athens | 1st | 3rd | 2nd |
|
| Barcelona | 2nd | 1st | 3rd | 3rd |
| Calgary | 3rd | 2nd | 1st |
|
Now Athens gets eliminated in the first round and Barcelona wins.
That’s really weird!
In a fair voting method, when one or more voters change their vote to help a candidate, it should not cause that candidate to lose.
Instant run-off voting fails the monotonicity criterion.
Note: In math, the word monotone means that when the inputs increase, then the outputs also increase. For voting that means that if a voter tries to help a candidate, it should actually help. Some people argue that run-off voting is a very bad system because it is not monotone.
In the late 1700’s, two French mathematicians got interested in this problem and tried to come up with better systems to run elections.


In the Borda count method, candidates get points from each ranked ballot. If there are n candidates running, then the first place candidate gets n points, second place gets n − 1, on down to the last candidate who only get 1 point. Then the winner of the election is the candidate with the most points.
| Number of Voters | ||||
|---|---|---|---|---|
| 10 | 20 | 30 | 5 | |
| Candidate A | 1st (3) | 2nd (2) | 3rd (1) | 3rd (1) |
| Candidate B | 2nd (2) | 1st (3) | 2nd (2) | 1st (3) |
| Candidate C | 3rd (1) | 3rd (1) | 1st (3) | 2nd (2) |
In the table above, the points are shown in red. Each column represents one possible ranking of the candidates, and the number of voters who picked that ranking is shown at the top of the column.
Exercise. Find the winner using Borda count.